Social Icons

Showing posts with label cyber forensic. Show all posts

Thursday, October 01, 2015

Burp Suite : Configuring the browser and redirecting traffic

1.   Vide my last post about installing Burp Suite here ,now I move ahead to configure your browser in order to redirect all HTTP/S requests through Burp Proxy, instead of the actual target website. In my case here I am configuring a Mozilla Browser with proxy host address to 127.0.0.1 and the proxy port to 8080 , for both HTTP and HTTPS.The typical configuring of browsers is more or less common with major browsers with minor differences in interfaces.Here next I place you screen shots as I surfed a redirected traffic both for http and https via Burp Suite.First steps to configure Mozilla followed by screen shots :

Configuring Mozilla Firefox

- Click Firefox menu and then Preferences.
- In the Advanced options, under the Network tab, click on connection Settings.
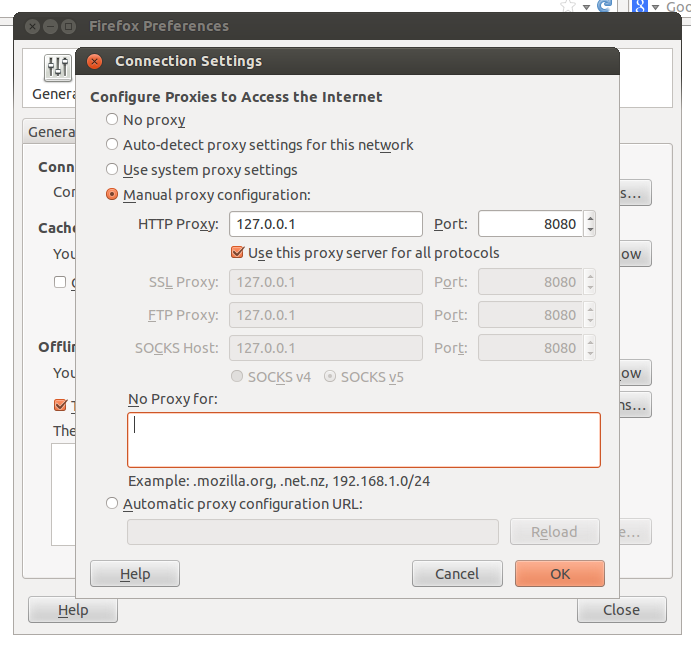
- Select Manual proxy configuration.
- Enter the proxy host address as 127.0.0.1 and the proxy port as 8080.
- Select Use this proxy server for all protocols.
- Make sure to remove all exceptions from the No Proxy for field.
- Click OK and close.


2.   So now you have a working installation of Burp Suite and your browser is properly configured to intercept all requests.Now to test go to the browser, enter any http://www.****** site in the address bar and press Enter . If all is well, Burp Proxy should intercept this request. In Burp Suite,go to the Proxy and Intercept tab and verify that the web request is waiting for your approval.Ensure tha the Intercept on button is enabled; click on it and allow the request to transit through Burp by pressing Forward in Burp Suite Interface. Now in the browser, you should see the http page you entered in address bar.

Now try a https site and you are bound to see this warning as seen below in the screenshot.You will be presented with a This Connection is Untrusted page.In such a case, you are required to manually approve the connection by clicking on I Understand The Risks, then Add Exceptions... and Confirm Security Exception. To make sure that Burp Proxy is actually causing the warning, you click on the certificate status View... and see that the certificate belongs to PortSwigger CA as seen below in one screenshot.

 PortSwigger CA certificate


This setup means that Burp Suite is now ready for use as the traffic is being redirected as desired as per configuration....

Monday, September 28, 2015

Volatility Framework Command : Using dlllist - dlldump to extricate DLLfile details

 This post will share an example to run the two volatility terminal commands including dllllist and dlldump  to display a process's loaded DLLs.

Before I proceed ahead,I would assume that you have installed volatility in your Linux system(in my case I am using UBUNTU, Installation explained at my earlier post at http://anupriti.blogspot.in/2015/09/volatility-advanced-memory-forensics.html) and you have a RAM dump of the OS u desire to analyse.In my case here I have taken the RAM dump of a Windows 7 OS as explained here at http://anupriti.blogspot.in/2015/09/volatility-command-using-imageinfo-to.html

dlllist

dlllist is used to display a process's loaded DLLs.DLLs are automatically added to this list when a process calls LoadLibrary (or some derivative such as LdrLoadDll).

vol.py --profile=Win7SP0x86 -f windows7_image.raw dlllist
To display the DLLs for a specific process instead of all processes, there is option to use the switch -p or --pid filter as shown below:

vol.py --profile=Win7SP0x86 -f windows7_image.raw dlllist --pid=1892

To display the DLLs for a process that is hidden or unlinked by a rootkit, first use the psscan to get the physical offset of the EPROCESS object and then:

vol.py --profile=Win7SP0x86 -f windows7_image.raw dlllist --offset=0x04a291a8
(Click on the image to ENLARGE)

dlldump

dlldump command is used to extract a DLL from a process's memory space and dump it to disk for analysis.The syntax is nearly the same as what has been seen earlier with any command.This plugin provisions the following :

- Dump all DLLs from a hidden/unlinked process (with --offset=OFFSET)
- Dump all DLLs from a specific process (with --pid=PID)
- Dump all DLLs from all processes
- Dump a PE from anywhere in process memory (with --base=BASEADDR), this option is useful for extracting hidden DLLs

To specify an output directory, use --dump-dir=DIR or -d DIR.

vol.py --profile=Win7SP0x86 -f windows7_image.raw dlldump --dump-dir output

where output is the name of directory where u get the dll dump


the output directory will be seen as seen below :


More at : https://code.google.com/p/volatility/wiki/CommandReference#dlllist

Sunday, September 27, 2015

Volatility Framework Command : Using pslist - pstree - psscan to identify process details from mem dump

This post will share an example to run the three volatility terminal commands including pslist, pstree and psscan

Before I proceed ahead,I would assume that you have installed volatility in your Linux system(in my case I am using UBUNTU,Installation explained at my earlier post at http://anupriti.blogspot.in/2015/09/volatility-advanced-memory-forensics.html) and you have a RAM dump of the OS u desire to analyse.In my case here I have taken the RAM dump of a Windows 7 OS as explained here at http://anupriti.blogspot.in/2015/09/volatility-command-using-imageinfo-to.html

Usage as follows :

pslist

The command pslist will be useful for any forensic prelim inquiry to find out the processes being run on the pc at the likely time of incident.The pslist command is used to list the processes of a system and it does not detect hidden or unlinked processes."pslist" module utilizes the same algorithm as the tasklist command that would be executed on the live computer. And also, Windows Task Manager uses the same approach as well.The command "pslist" traverses the list of active process structures that the Windows kernel maintains.The screen shot below shows a task manager activity of a windows PC i am using for test.Subsequently I have taken a fresh dump at this time and then analysed this dump with volatility on UBUNTU to find the process details which actually come out as the same as seen in the screenshots below :

Windows TASK MANAGER as seen in Windows OS
(CLICK TO ENLARGE)
The command usage at terminal syntax goes like this :
vol.py --profile=Win7SP0x86 -f windows_memory.raw pslist

Click on image to ENLARGE

Click on image to ENLARGE
 [TRIM]
Click on image to ENLARGE
 [TRIM]

The columns display the offset, process name, process ID, the parent process ID, number of threads, number of handles, and date/time when the process started. The offset is a virtual address by default, but the physical offset can be obtained with the -P switch as seen in the command below with screenshot.

vol.py --profile=Win7SP0x86 -f windows_memory.raw pslist -P

(Output with -P Switch)
Click on image to ENLARGE

pstree

pstree command is used to view the process listing in tree form and enumerates processes using the same technique as pslist, so it will also not show hidden or unlinked processes. Child process are indicated using indention and periods.SCreen shot of output and syntax as below :

vol.py --profile=Win7SP0x86 -f windows_memory.raw pstree

Click on image to ENLARGE

 psscan

psscan is used to enumerate processes by pool tag scanning and can find processes that previously terminated (inactive) and processes that have been hidden or unlinked by a rootkit. Syntax and screenshot of output as follows:

vol.py --profile=Win7SP0x86 -f win7.dmp psscan

Click on image to ENLARGE


Tuesday, September 22, 2015

Volatility-Advanced Memory Forensics Framework : Installation@Ubuntu

1.   The Volatility Framework is a completely open collection of tools, implemented in Python for the extraction of digital artifacts from volatile memory (RAM) samples. Volatility is a memory forensics framework, to analyse ram memory dumps for Windows, Linux, and Mac. In order to analyse a operating system’s RAM memory in Volatility, you need to build the corresponding operating system’s profile.The extraction techniques are performed completely independent of the system being investigated but offer unprecedented visibility into the runtime state of the system. The framework is intended to introduce people to the techniques and complexities associated with extracting digital artifacts from volatile memory samples and provide a platform for further work into this exciting area of research.Vide this post, I am sharing how to install volatility in Ubuntu 12.04 in a step wise manner.The post includes screen-shots and ready to shoot terminal commands for installing other dependent libraries.

Firstly : Installing Dependencies

sudo apt-get install subversion pcregrep libpcre++-dev python-dev -y

Secondly : Installing PyCrypto

First download PyCRypto from https://ftp.dlitz.net/pub/dlitz/crypto/pycrypto/pycrypto-2.6.1.tar.gz

Go to ~/..../Downloads/

tar -zxvf pycrypto-2.6.1.tar.gz

cd pycrypto-2.6.1

python setup.py build

sudo python setup.py build install


Thirdly: Installing Distrom
Distrom ,a disassemble library for x86/AMD64 can be downloaded from https://github.com/gdabah/distorm

Goto downloads where the file is likely downloaded :

unzip distorm3.zip

cd distorm3/

python setup.py build

python setup.py build install

Fourthly: Installing Yara 

Volatility needs another important dependency known as Yara,that can be installed as follows:

wget http://yara-project.googlecode.com/files/yara-1.4.tar.gz

tar -zxvf yara-1.4.tar.gz

cd yara-1.4/

sudo ./configure

sudo make

sudo make install


Fifthly : Installing Yara-Python


Download the tar.gz from https://yara-project.googlecode.com/files/yara-python-1.4a.tar.gz

tar -zxvf yara-python-1.4a.tar.gz

cd yara-python-1.4a/

python setup.py build

python setup.py build install

sudo echo “/usr/local/lib” >> /etc/ld.so.conf

sudo ldconfig
Now through with the installation of dependencies,we go ahead to install Volatility after we download the tar ball from https://code.google.com/p/volatility/downloads/detail?name=volatility-2.3.1.tar.gz&can=2&q=


~/Desktop/F0r3ns1c5/Memory_Forensics/New/volatility-2.3.1$ python setup.py build

~/Desktop/F0r3ns1c5/Memory_Forensics/New/volatility-2.3.1$ python setup.py build install

The installation is complete now and you should get a similar screen as seen below on running the command python vol.py -h

Friday, August 22, 2014

FOCA : Extracting website Meta data

1.    Metadata is "data about data". It provides info about a certain item's content like for example, an image may include metadata that describes when was the picture clicked,which camera was used to click the image,the resolution etc. A text document's metadata may contain information about how long the document is, who the author is, when the document was written, and a short summary kind of document.Metadata can be useful to Penetration Testers,because it contains information about the system where the file was created, such as Name of users logged into the system,Software that created the document and OS of the system that created the document.This post will introduce to a tool know as FOCA ...that stands for

Once the project is named and u locate to store the project files, click on the Create button, as shown below :

Next thing to do is save the project file and click on the Search All button so FOCA will use search engines to scan for documents.


Right-click on the file and select the Download option, as shown below:

Right-click on the file and select the Extract Metadata option, as shown below :

Right-click on the file and select the Analyze Metadata option, as shown above :
 One can see the user who created and used this document as seen below :
You can also see what all software’s have been used to create the document.
In many cases, attackers will be able to see much more information and gather intelligence about a target, the network, usernames, etc… by using this tool.Though the tool is available with Kali but with newer versions it is only available with Windows....


Wednesday, July 09, 2014

DEFT : Digital Evidence & Forensic Toolkit Live DVD

1. DEFT (Digital Evidence & Forensic Toolkit) is a customized distribution of the Ubuntu live Linux CD@12.10. It is an easy-to-use system that includes excellent hardware detection and some of the best open-source applications dedicated to incident response and computer forensics.DEFT comes bundled with DART2 (Digital Advanced Response Toolkit) and the very best open source Windows Computer Forensic tools. Using LXDE as desktop environment and WINE to manage Windows tools under a Linux kernel, and a mount manager as tool for device management, this distro has a loyal following and we encourage you to use it.DEFT seems to be very well supported with a long list of official developers and contributors. The main developers seem to be a mix of professors, forensic (legal) experts, consultants, engineers, network specialists and more. Several law enforcement professionals are also associated with this project making it a forensics tool of choice for Information Security professionals. According to their site the distro is designed to be used by anyone working within a Response, Cyber Intelligence and/ or Computer Forensics capacity.

2.   Further to this very basic intro I give you here the screenshots as I set it up live on my virtual box.

                                   (Click on Image for enlarged view)
                                   (Click on Image for enlarged view)
                                     (Click on Image for enlarged view)
                                      (Click on Image for enlarged view)
                                        (Click on Image for enlarged view)
                                       (Click on Image for enlarged view)
                                      (Click on Image for enlarged view)
                                       (Click on Image for enlarged view)
                                       (Click on Image for enlarged view)
                                       (Click on Image for enlarged view)
                                       (Click on Image for enlarged view)
                                       (Click on Image for enlarged view)
                                       (Click on Image for enlarged view)
                                       (Click on Image for enlarged view)
                                       (Click on Image for enlarged view)

3.   Details at http://www.deftlinux.net/
Powered By Blogger